Console diagnostic mode
In addition to logging weather data, the console continuously monitors the station’s radio reception. You may find this information very helpful, especially when you are choosing locations for your console and ISS. The Console Diagnostics Mode consists of two screens, the Statistical Diagnostic Screen and the Reception Diagnostic Screen. The Statistical Diagnostic screen applies for both cabled and wireless weather stations. The Reception Diagnostic screen applies only to wireless weather stations and is not accessible to a cabled weather station.
Note: Radio transmission data used by the diagnostic screens clears each day at midnight.
Diagnostic Screen Commands • Press and hold TEMP, then press HUM to display the Statistical Diagnostic screen.
- Press the > key to display signal statistics for the next installed transmitter ID.
- Press 2ND and then press CHILL to toggle between the Statistical and Reception Diagnostic screens.
- A degree (°) sign displays in right corner of value 1 of the Reception Diagnostic screen (screen 2) to differentiate which screen is currently displayed.
- Press DONE to exit the diagnostic screen.
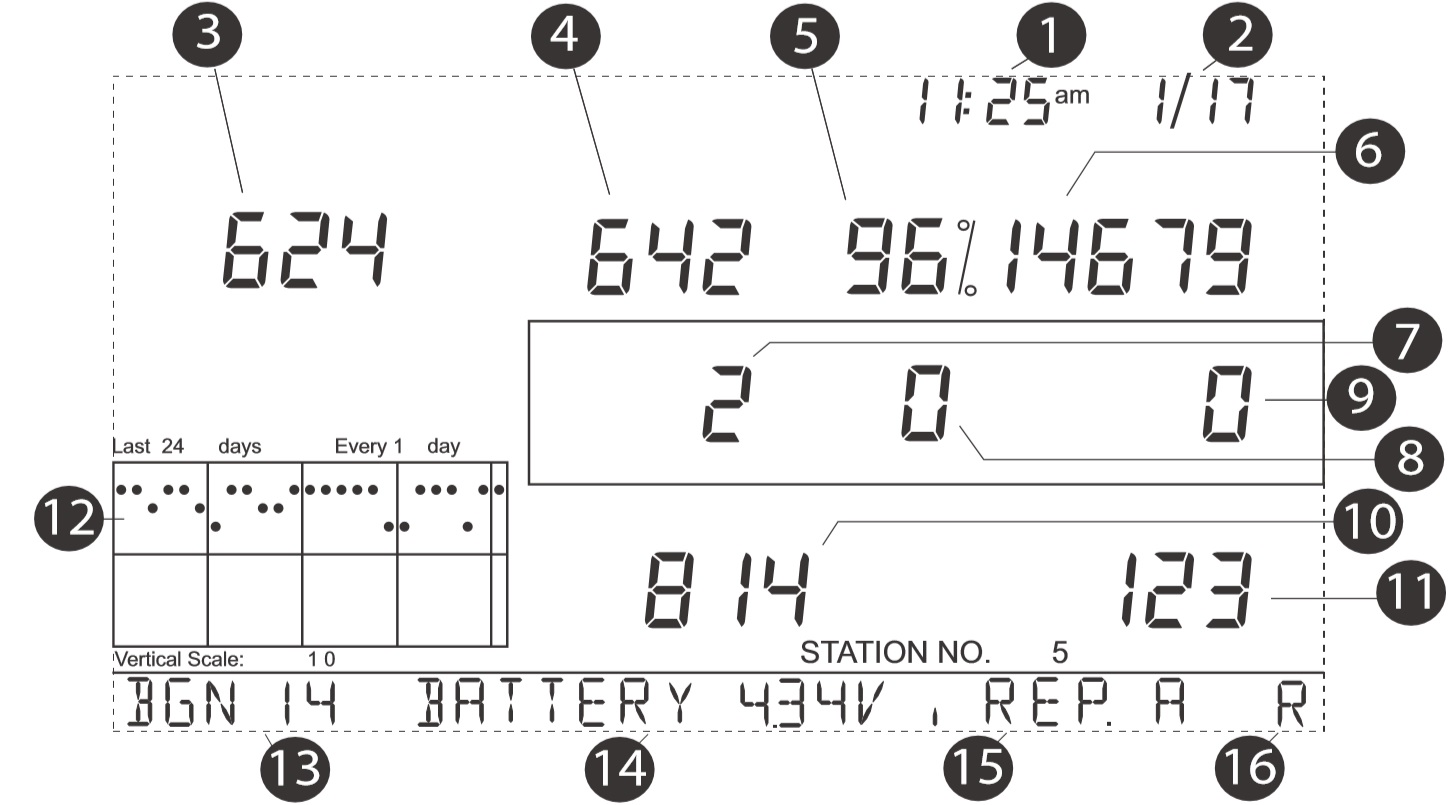
Screen 1: Statistical Diagnostic Screen
The Statistical Diagnostic displays information about how data is being received from the weather station to the console. The information that is displayed in this screen includes:
Note: All values with a * mark the value as being for Davis Instruments Internal use. All values with a ‡ mark values that are the same on both the Statistical and Reception Diagnostic screens.
- Time of day or number of times the anemometer switch was seen closed*.The switch closes once each revolution of the anemometer wind cups. Press WIND to toggle between these two values.
- Date or the number of times the anemometer switch was seen open*. Press WIND to toggle between these two values.
- Number of packets containing CRC errors received. The system runs a CRC check on data packets. Any data packets that don’t pass this check are considered to contain errors and are discarded. These are considered bad packets.
- The total number of bad data packets including missed packets and CRC errors. Missed packets are described as when a data packet is expected, but is not recognized as a data packet by the console.
- Percentage of good packets received.
- Total number of good packets received.
- Number of times the console resynchronized with the transmitter. The console will attempt to resynchronize with the station after 20 consecutive bad packets.
- Maximum number of bad packets in a row without resynchronization.
- Current streak of consecutive bad packets. The counter increments when the console is synchronized but the packet is bad. This value is reset to zero when a good packet is received.
- Longest streak of consecutive good packets received.
- Current streak of consecutive good packets received.
- Graph of the daily percentage of good data packets received over the last 24 days.
- Background noise level. This refers to the undesirable signal level the console hears while it is in the process of acquiring a signal from a station. The range displayed is from 5 to 60. When the noise level is high, try to move the console closer to the station to get a stronger signal. Small background noise level does not always guarantee good reception. The signal strength between the station and the console needs to be stronger than the background noise level in order for the console to receive clearly. If there are reception problems while a small background noise level is still being displayed, make sure the console is within reasonable range of the station. If the console currently has acquired all the station signals it is set to receive, the background noise level displayed is the last noise level measurement taken before acquisition finished.
- Current console battery voltage. Ignore this value if using the AC Adapter only to power the console.
- Repeater ID currently communicating with the console. If a repeater or group of repeaters is used to relay station information to the console, the Repeater ID displayed is the repeater that the console is set to receive. If the console is not listening to repeaters, this section remains blank. Please see Application Note 25 available on the Davis Instruments Support web page for more information on using repeaters.
- The console’s reception status. See “Troubleshooting Reception Problems” on page 38 for information on the status types.
Screen 2: Reception Diagnostic Screen
The Reception Diagnostic screen displays information pertinent to the console’s wireless reception. To view this screen from the Statistical Diagnostic screen, press 2ND and then press CHILL. The degree sign displaying in the upper left corner next to value 1 verifies that the Reception Diagnostic screen is currently displayed.
The information that is displayed in this screen includes:
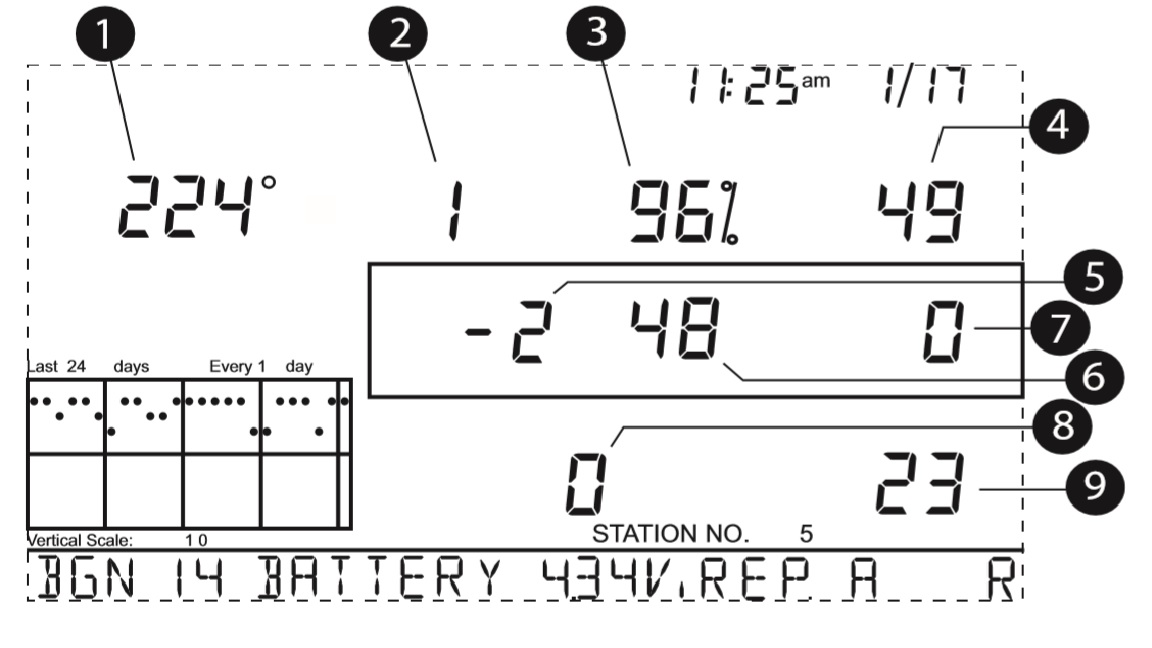
- 8-bit timer value of next reception.*
- Radio frequency error of the last packet received successfully. In normal operation, this value is +1, -1, or 0. This value affects the value of #5 on the next page.
- Percentage of good data packets.‡
- Signal strength of the last packet received. The values displayed in this field should generally be between 20 and 60. If a packet is not received successfully, the signal strength field is dashed out (--).
- Current frequency correction factor. Shows the Automatic Frequency Control setting.
- Frequency index of the next packet to be received.*
- Current number of consecutive bad packets.‡
- The number of times that the Phase Lock Loop did not lock.*
- Current streak of consecutive good packets received.‡